Analytics
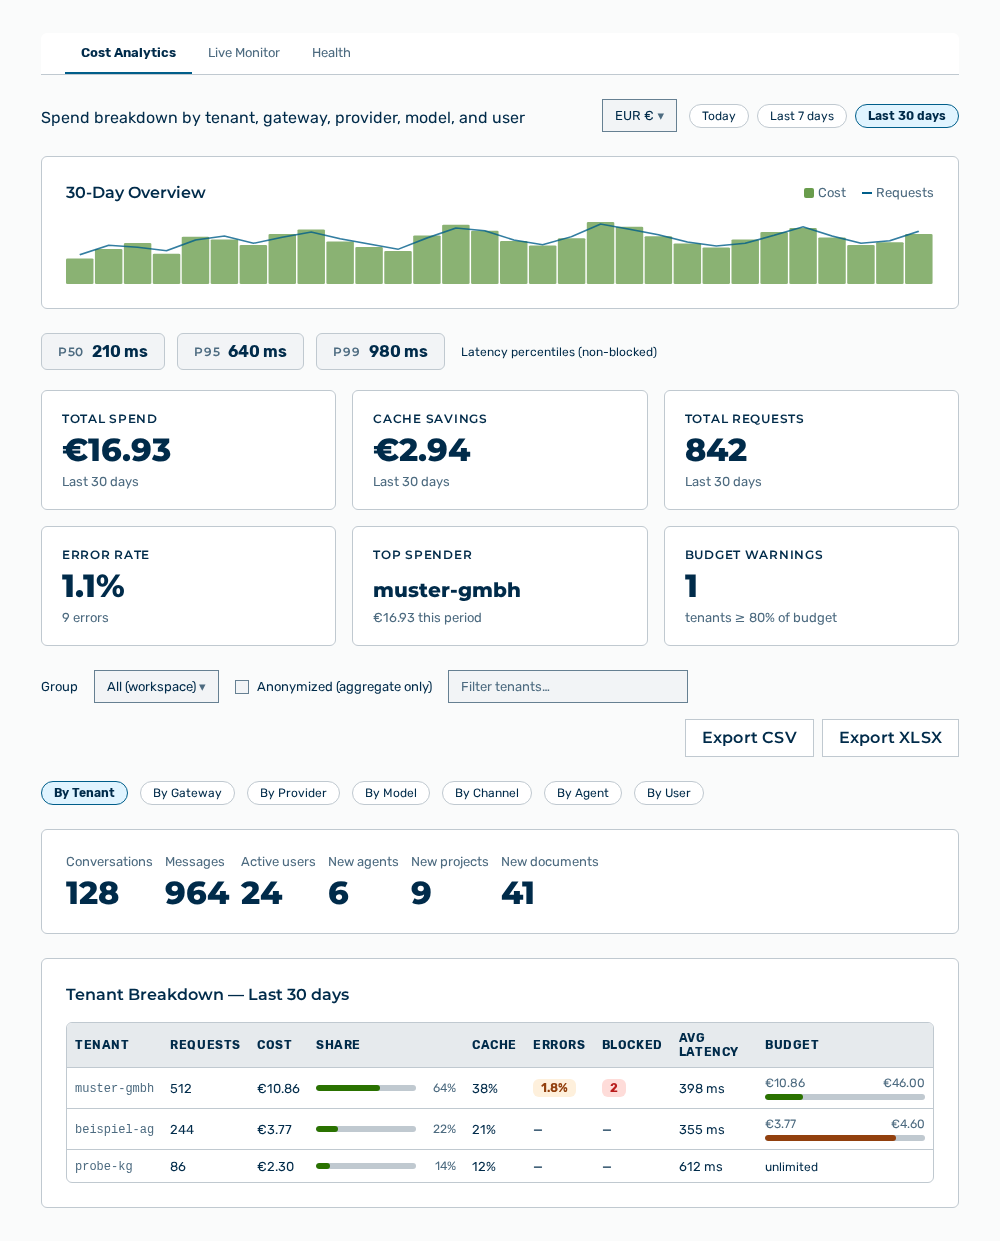
Cost Analytics view
The Analytics view shows the evaluations of the cost and the operation.
The following tabs are available:
| Tab | Description |
|---|---|
| Cost Analytics | Breaks the spend down by tenant, gateway, provider, model, and user. |
| Live Monitor | Shows the running requests in real time. |
| Health | Shows the operational state across the failure surfaces of the last 24 hours. An empty cell means that this surface is healthy. |
The following sections describe the view in detail: