Analytics
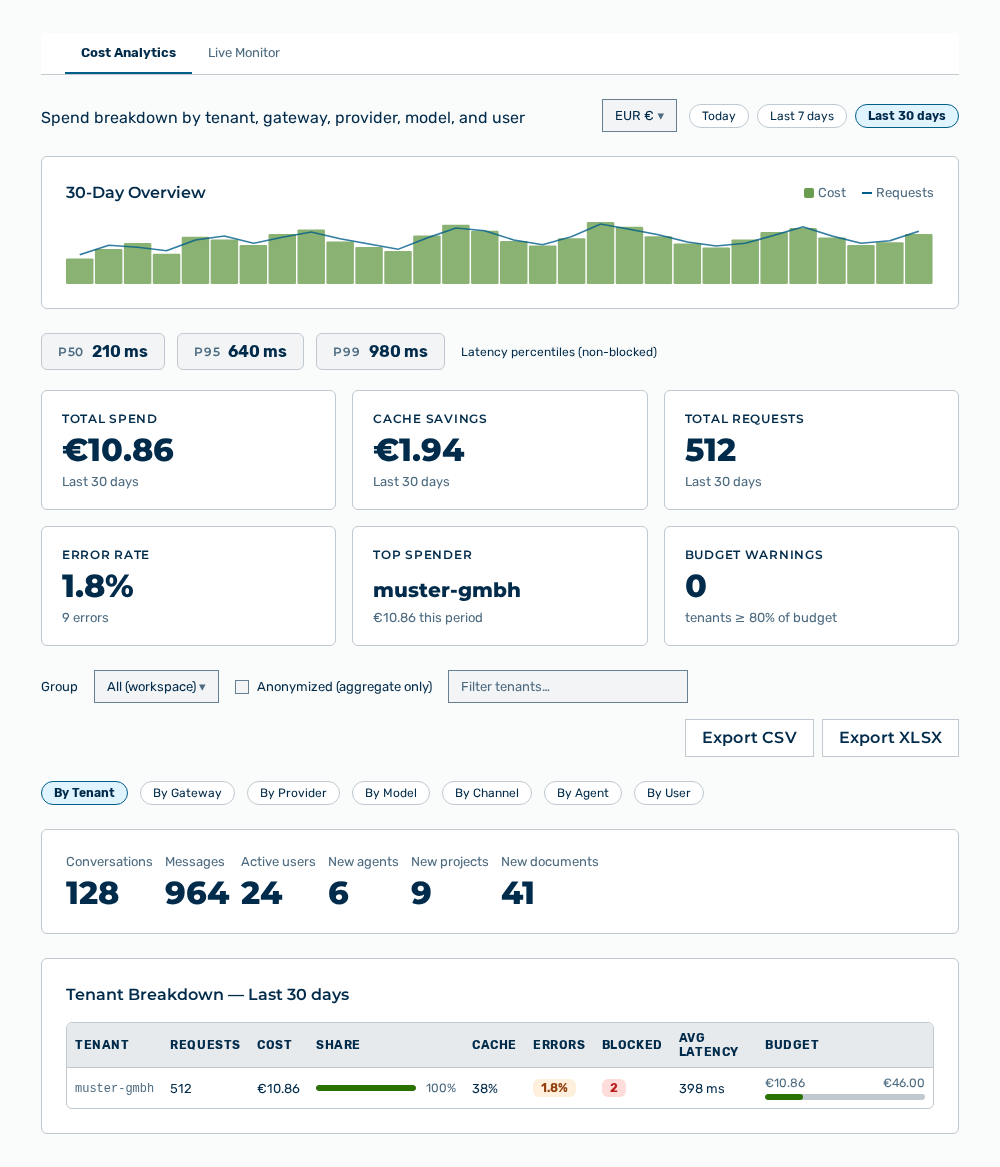
Cost Analytics view
The Analytics view shows the evaluations of the cost and the operation of the tenant.
The following tabs are available:
| Tab | Description |
|---|---|
| Cost Analytics | Breaks the spend down by tenant, gateway, provider, model, and user. |
| Live Monitor | Shows the running requests in real time. |
Note
For the AI Manager role, the entry opens the Cost Analytics view without a tab bar. The Live Monitor tab does not appear for it. For the Finance role, the Analytics entry does not appear. For it, the Costs group of the Settings area shows the cost per user.
The following sections describe the view in detail: