Live Monitor tab
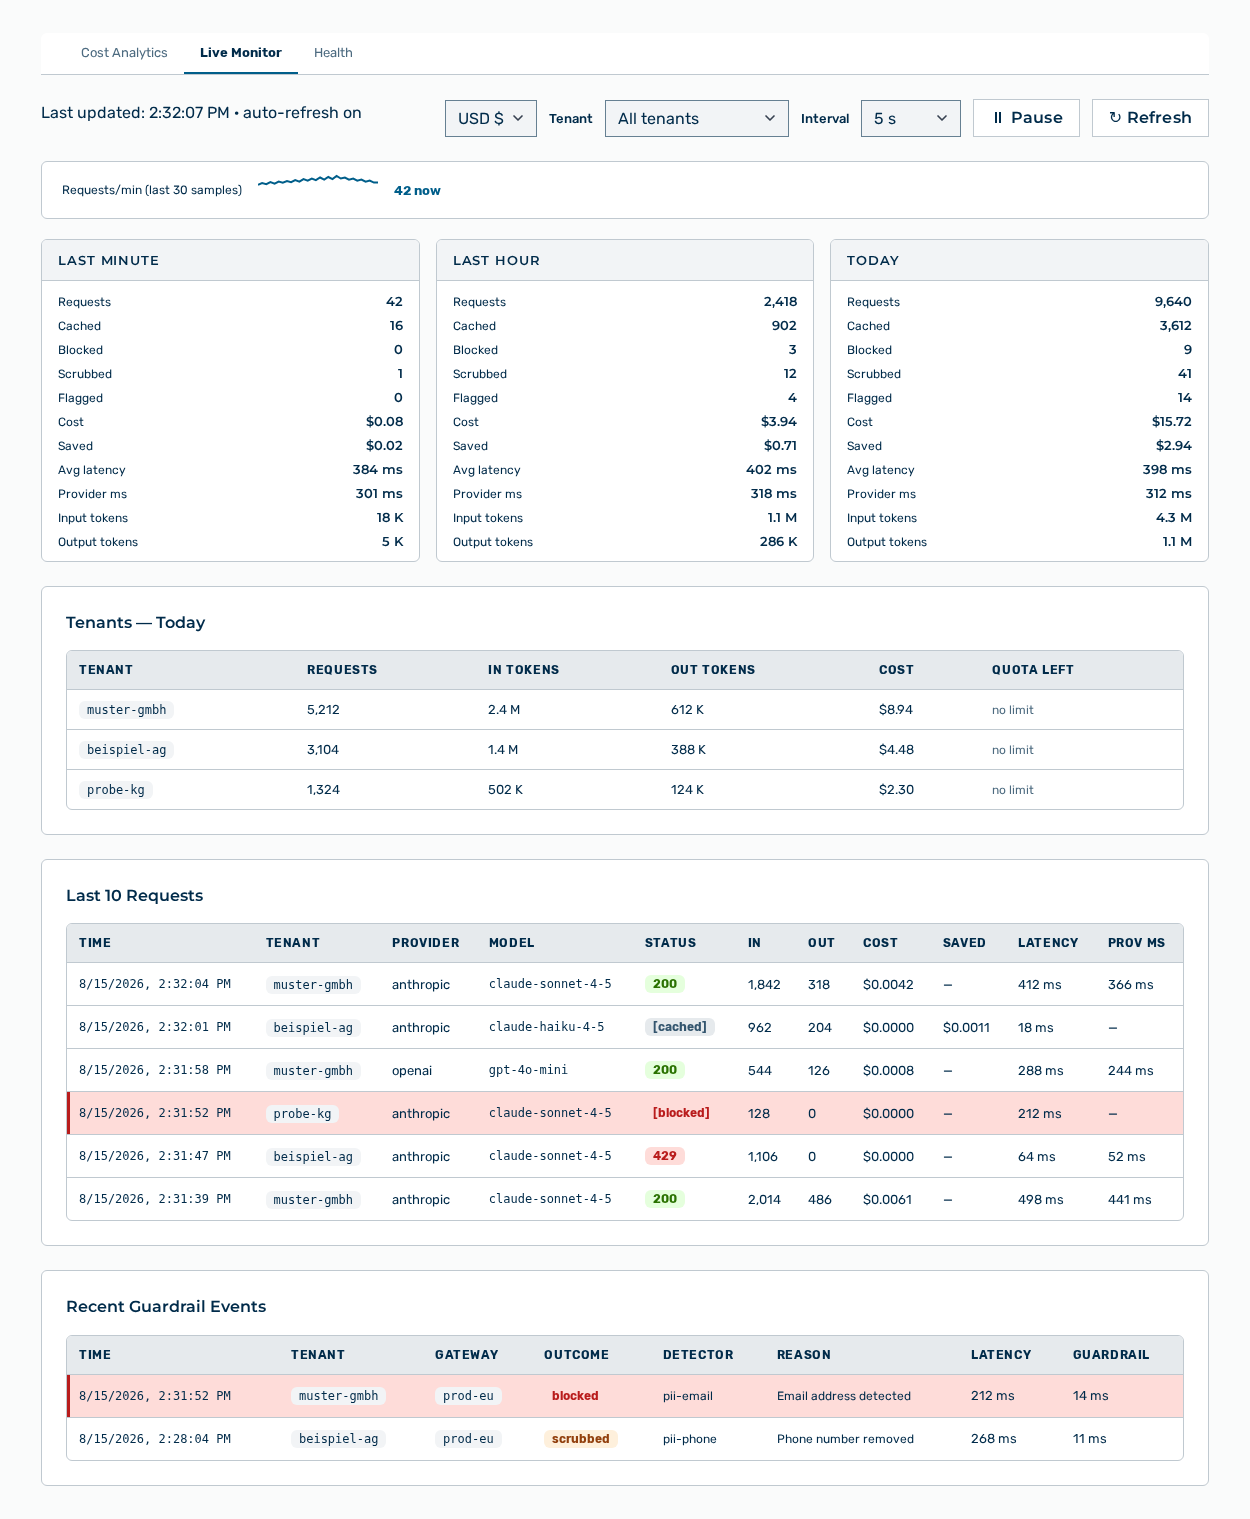
Live Monitor tab
The Live Monitor tab shows the running requests in real time and refreshes itself. The header names the time of the last refresh as well as the state of the auto-refresh as on or paused.
The following information is available:
| Area | Description |
|---|---|
| Requests/min | Course of the requests per minute over the last samples. The |
| Last minute, Last hour, and Today | Metrics of the respective period: Requests, Cached, Blocked, Scrubbed, Flagged, Cost, Saved, Avg latency, Provider ms, Input tokens, and Output tokens. |
| Tenants — Today | Usage per tenant with the Tenant, Requests, In Tokens, Out Tokens, Cost, and Quota Left columns. If the tenant holds no budget, then the Quota Left column shows the value no limit. |
| Last 10 Requests | Last requests with the Time, Tenant, Provider, Model, Status, In, Out, Cost, Saved, Latency, and Prov ms columns. The blocked label stands for a blocked request, the cached label for a response from the cache. |
| Recent Guardrail Events | Last hits of the content rules. |
The following options are available:
| Option | Description |
|---|---|
| Tenant selection list | Restricts the display to one tenant. The All tenants entry removes the restriction. |
| Interval selection list | Interval of the auto-refresh: 1 s, 2 s, 3 s, 5 s, 10 s, or 30 s. |
| ⏸ Pause button | Stops the auto-refresh. After that, the button carries the ▶ Resume label. |
| ↻ Refresh button | Loads the values again immediately. |
Note
If no request is available yet, then the tab reports No requests yet.
Note
If no data is available for the selected period, then the view reports No data for this period. If the loading fails, then the view reports Failed to load analytics.