Dashboard
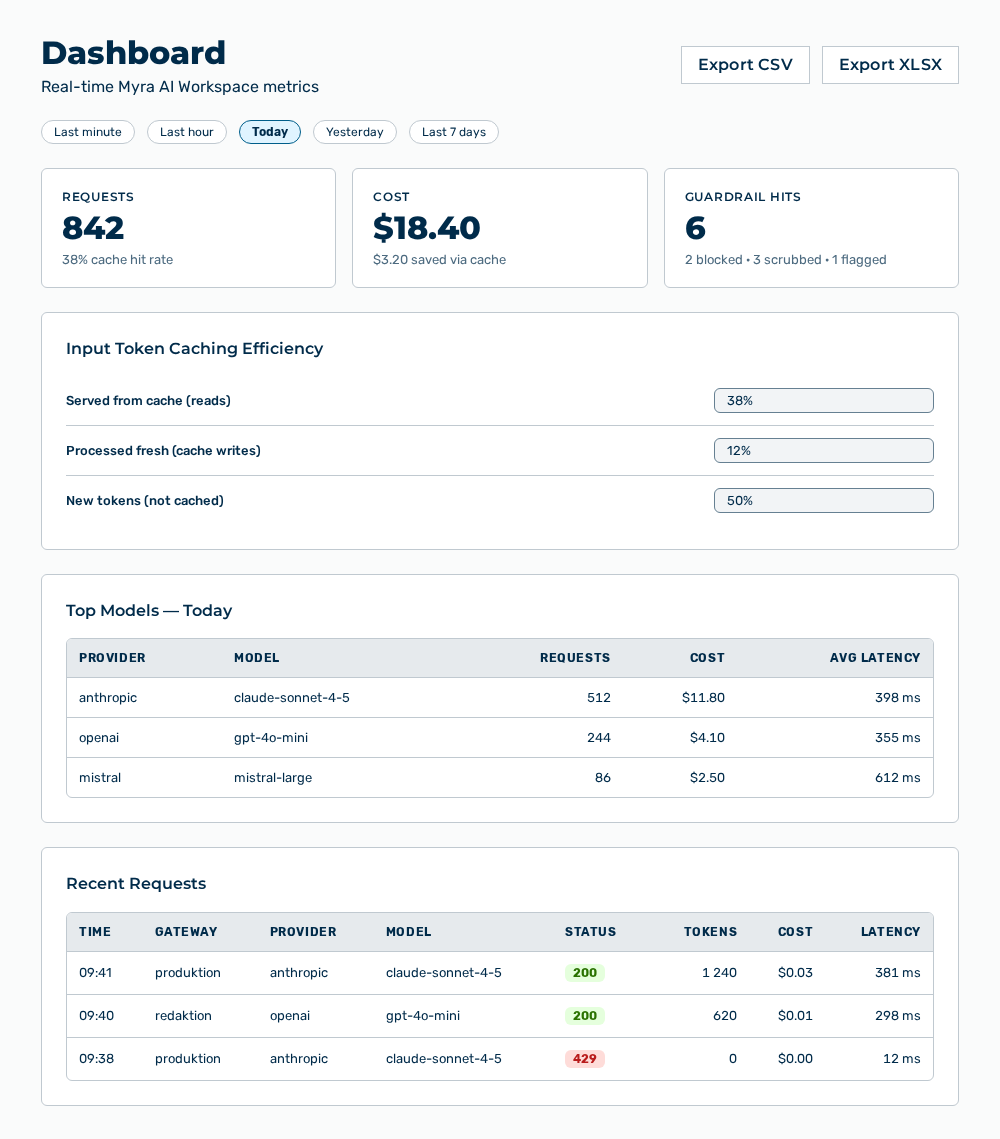
Dashboard view
The Dashboard view shows the real-time metrics of Myra AI Workspace. The header carries the Real-time Myra AI Workspace metrics subtitle.
The following metric areas are available:
| Metric | Description |
|---|---|
| Requests | Number of the requests of the selected period. The subline names the cache hit rate as |
| Cost | Cost of the selected period. The subline names the saving as |
| Guardrail Hits | Number of the hits of the content rules. The subline breaks the hits down as |
The following information is available:
| Area | Description |
|---|---|
| Input Token Caching Efficiency | Share of the input tokens that came from the cache, with the Served from cache (reads), Processed fresh (cache writes), and New tokens (not cached) bars. Below that, the area names the Cached input cost line with the (reads at 0.1× rate) addition, the Uncached input cost line with the (writes + new tokens) addition, and the Compaction saved line. The area appears only if tokens are in the cache. |
| Usage by Tenant — |
Usage per tenant with the Tenant, Requests, Input Tokens, Output Tokens, and Cost columns. |
| Top Models — |
Most used models with the Provider, Model, Requests, Cost, and Avg Latency columns. |
| Recent Requests | Last requests with the Time, Tenant, Gateway, Provider, Model, Status, Tokens, Cost, Latency, and Flags columns. A flag is cached, blocked, or rate limited. |
| Recent Guardrail Events | Last hits of the content rules with the Time, Tenant, Gateway, Outcome, Detector, Reason, and Latency columns. You can expand a row, which then shows the Prompt sent to LLM (after PII substitution) and the LLM response (before PII token restoration). |
The following options are available:
| Option | Description |
|---|---|
| Today, Yesterday, Last 7 days, Last hour, and Last minute tabs | Period of the evaluation. The period applies to the metric areas and to the Usage by Tenant and Top Models areas. |
| Export CSV button | Downloads the metrics of all periods and the model breakdown of the selected period as a CSV file. |
| Export XLSX button | Downloads the same data as an Excel file. |
Above the view, a notice banner appears when a budget reaches its limit. The banner names the scope as Tenant, Gateway, Token, Plan allowance, or Rate limit, carries the Manage token link for a token, and the Manage in gateway settings link for a service token. The Dismiss button hides the banner.
Note
In a new workspace, the view reports No data yet with the This is a new workspace — your dashboard will fill in with real metrics as you start using the applications. hint and the Use Applications button. If the loading fails, then the view reports Couldn't load your usage stats. and offers the Retry button. For the roles without an analytics permission, the view carries the My Usage title with the Your personal API usage subtitle and shows your personal usage only. The export buttons as well as the Usage by Tenant, Top Models, and Recent Guardrail Events areas do not appear then.
Note
For the Finance role, the view has the My usage title and shows its own usage only.