Request Trace area
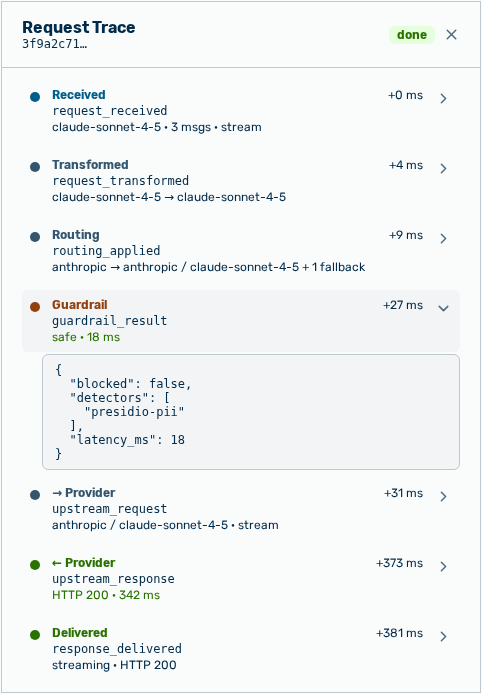
Request trace area
The area opens via the View trace icon and shows the path of the request through the gateway as a sequence of steps.
The following information is available:
| Item | Description |
|---|---|
| Item below the heading | First eight characters of the trace ID, followed by …. |
| Badge next to the heading | Status of the trace: done, blocked, or error. |
The following steps are available:
| Step | Description |
|---|---|
| Received | The gateway accepted the request. The step names the model, the number of the messages, and the stream addition for a streaming request. |
| Transformed | The gateway translated the request into the format of the provider. |
| Routing | The gateway selected the target. The step names the number of the fallbacks. |
| Guardrail | The guardrails checked the request. The step names the verdict, for example safe. |
| → Provider | The gateway sent the request to the provider. The step names the attempt, for example attempt 2. |
| ← Provider | The provider responded. |
| Provider Error | The provider responded with an error. |
| Delivered | The gateway delivered the response. The step names the size of the response or the streaming addition. |
The following options are available in the area:
| Option | Description |
|---|---|
| Row of a step | Shows and hides the recorded data of the step as JSON. |
| Close icon | Closes the area. |
Note
If no request matches the filters, then the view reports No logs match your filters. If the loading fails, then the view reports Failed to load logs. If the request logging is disabled for the selected tenant, then the view reports Request logging is disabled for tenant "